 | ||||


 | ||||
|
WELCOME TO THE ESSAY ARCHIVES!
<< June
<< Part I
(June/July)
<< June
<< June
<< June
<< Part I
(June/July)
* * *
|
2008 Essays - June/July "PETROMORPHOSIS" PART I: "PAY'N" AT THE PUMP
* In 2008, crude oil and retail gas prices have hit all-time highs. This year's essay series, "Petromorphosis," will take a look at issues concerning gas prices and the future of petroleum and other energy sources, with a focus on fuels. The issues and the industry both are extremely complex - far beyond what can be covered in depth in a forum such as this one. What will be presented is a brief summary of basic ideas and topics, ones which hopefully will help illustrate and explain the current situation as it relates to your lives now and in the near future. The essay is interactive in the sense that links are embedded within the text. The article can be read as is, or one can click on a link to read more about the subject at hand, then return to the essay. (Please note: The links are included for information purposes only. No guarantees are made as to the accuracy of the materials presented on the sites, although every effort has been made to search out reliable and respected sources of information.) Footnotes and a bibliography also will be included at the end for anyone wishing to learn more about the subject. A glossary link for energy-related terms is provided as a reference for use as needed. Click here to reach the glossary. *
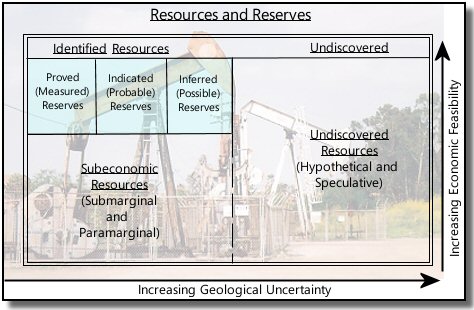
In the last 30 to 40 years, spikes in the retail prices of gasoline were for the most part easily explained: the Arab Oil Embargo and Iranian revolution during the 1970s, the start of the Gulf War in Kuwait in the 1990s, and more recently disruptions in Gulf Coast refineries and other facilities in the wake of Hurricane Katrina. This time around, however, causes cited by experts and in the press are neither as cut-and-dried nor as immediately obvious to the consumer. Take the following two explanations, for example. In the May 2008 issue of the Oil Market Report (www.oilmarketreport.org), a monthly publication of the International Energy Agency, it was stated that, "NYMEX light sweet crude futures were double the levels of a year ago in early May, topping $126/bbl as strong demand from Asia and tight distillate markets pushed prices higher. Sentiment was further underpinned by crude outages, particularly in Nigeria and the North Sea. Refining margins rose in April, but remain volatile." (n1) The Automobile Club of California also reported on its website-based price summary information for June 13 that "California is the only state in the U.S. right now that is experiencing this painful level of price increases, and oil industry analysts say it is almost totally driven by fund manager investment in California wholesale gasoline futures." (n2) Speculation on the futures market? Demand in Asia? Nigerian supply disruptions? Demand for distillates? Peak oil? Refinery capacity? A weak dollar? All of these factors have been named as potential contributors to the rise in gasoline prices, with no one factor unanimously singled out as having exerted the greatest upward pressure or influence on prices to date. The remainder of this first part of the summer's three-part series will examine some of these factors individually and conclude with a few options for dealing with gas prices now. Before continuing, though, ask yourself how much you really know about the gallon of gas you're putting into your car's tank. If you'd like, you can click on either of the links below to take the American Petroleum Institute's five-minute Energy IQ Quiz before reading on. * * www.apitechtour.org, click "Energy IQ Quiz", or www.apitechtour.org/game_1.html * * Crude Oil, The Futures Market and Speculation The most significant portion of the cost of gasoline is the crude oil from which it is produced. In the first quarter of this year, crude oil made up about 70% of the pump price of gasoline, with refining and retailing costs at about 17% of the total and taxes accounting for the other 13%. (n3) The term "light sweet crude" refers to high quality oil with a low sulfur content, the type most preferred for refining into gasoline. Thicker crude oils are generally considered to be of lower quality, and oils with a higher sulfur content are referred to as "sour." (n4) Crude oil futures are traded on the New York Mercantile Exchange, or NYMEX (www.nymex.com), and NYMEX is regulated by the Commodity Futures Trading Commission (CFTC, www.cftc.gov). The CFTC is an independent agency of the U.S. government with "exclusive jurisdiction over futures trading in all commodities." (n5) The international benchmark price for a barrel of crude is set based on contract prices for light sweet crude on the NYMEX. Many have blamed speculation in the futures market for driving up the contract price of a barrel of oil and therefore the ultimate cost to consumers at the pump. In OPEC's Monthly Oil Market Report for June 2008, a report on the oil market outlook for the second half of 2008 says that ". . . this strong [price] volatility reconfirms the view that current price levels do not reflect supply and demand realities but are strongly influenced by future market activities and the prevailing bullish sentiment. A review of prospects for the remainder of the year also shows little support for prices to remain at current levels." (n6) At the same time, however, others have expressed different opinions on the current situation. The Economist magazine has reported that Jeffrey Harris, chief economist of the CFTC, "does not see any evidence that the growth in speculation . . . has caused the price to rise . . . Investment can flood into the oil market without driving up prices because speculators are not buying actual crude. Instead, they buy contracts for future delivery. When those contracts mature, they either settle them with a cash payment or sell them to genuine consumers . . . The contracts are really a bet about which way the price will go and the number of bets does not affect the amount of oil available." (n7) Resources, Reseves and "Peak Oil" So what does affect the amount of oil available? Before discussing the global growth in demand, three terms with particular importance to the industry will be defined: resources, reserves and "peak oil." A resource is a concentration of a naturally-occurring material, such as oil, that is considered to be potentially recoverable. Resources can be identified (located and measured) or undiscovered (thought to exist based on theory or broad geological knowledge). A reserve is the portion of an identified resource from which a usable commodity (such as oil) can be economically and legally extracted. (n8) "Reserves must satisfy four criteria: they must be discovered, recoverable, commercial and remaining based on the development technologies currently applied." (n9) Proved (or measured) reserves are reserves for which tonnage and grade (the amount and quality) can be computed and judged within certain limits. (n10) The chart below may help you visualize the distinction between resources and reserves.
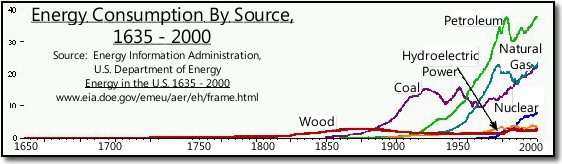
Chart sources: Statement of Dr. Vincent E. McKelvey, Director, U.S. Geological Survey, Department of the Interior, in Market Performance and Competition in the Petroleum Industry, Hearings before the Special Subcommittee on Integrated Oil Operations, Committee on Interior and Insular Affairs of the U.S. Senate, January/February 1974, p. 1542, and National Petroleum Council (NPC), Hard Truths: Facing the Hard Truths About Energy, Washington D.C.: NPC, July 2007, p. 96. One of the most common phrases used in discussions of the oil industry is that of proved (or proven) reserves. These "reserves are concentrated in the Middle East and North Africa [which] together [account] for 62% of the world total. . . [It is estimated that] the world's proven reserves, including non-conventional oil, could sustain current production levels for 42 years." (n11) Forty-two years? Does that mean that the world will run out of oil at that time? The answer is not exactly. To begin with, data on proved reserves is closely held by the countries and companies owning the oil. Though estimates are widely published, precise, exact figures are not known. Also, the current reserve figures don't take into account new discoveries of oil. Still, as a fossil fuel, oil is a finite resource. Whether the amount which can be extracted is sufficient to last another 50, 100, 150 or more years is a matter of intense debate. More important is the fact that at some point reserves will be depleted. On a broad historical scale, the age of the use of petroleum - sometimes called the hydrocarbon age - is a relatively new phenomenon, as shown in the graph below. It was primarily in the 20th century that oil and its byproducts came to fuel the world. As demand for oil continues to grow, however, some estimate that "non-OPEC production of conventional crude oil and natural gas liquids is to peak within a decade." (n12)
But what do forecasters mean when they say production will "peak"? The phrase can be applied to both individual oil fields and overall global output, and it refers to the point at
which half the oil available has been produced. After that production levels begin to fall, and oil can become more expensive to extract (think of the resources/reserves chart). The diagram below illustrates what is known as the "Hubbert Resources Curve." The curve in essence
depicts the lifespan of fossil resources. M. King Hubbert, a geologist, physicist and economist, "first shocked the oil industry in 1956 with his accurate prediction of a peaking in domestic (lower 48 states) oil production between 1966 and 1971 at a time when the consensus view
called for infinite growth potential. Hubbert's prediction was proven out when U.S. crude oil output peaked . . . in 1970" [excluding Alaska]. (n13)
Chart source: Oil Outlook: Price, Supply, Mergers, Imports and Taxes, Hearings before the Subcommittee on Fossil and Synthetic Fuels, Committee on Energy and Commerce, House of Representatives, 99th Congress, First Session, Serial Number
99-79, Washington, D.C.: U.S. GPO, 1985, p. 295. In the diagram, the complete cycle of U.S. crude oil production estimated in 1980 is superimposed on Hubbert's 1972 logistic equation. In its simplest sense, "Hubbert's thesis is based on the finite nature of all resources
[as depicted] in a bell-shaped curve. The 1920 - 1940 boom in the [U.S.] oil industry coincides with the first half of Hubbert's curve. With the giant field discovery potential exhausted, the industry then dipped down the slope of the bell with ever-increasing amounts of capital required to discover
smaller and smaller oil deposits. (n14) Although global peak oil estimates vary widely, many forecasts place production as peaking in the years between 2015 and 2030 (n15) (though this can be altered by new discoveries, improvements in the technology
of production/extraction, or changes in demand).
Supply, Demand and Geopolitics Today in the United States about 60% of the country's oil comes from imports. (n16) (In California, this figure is slightly different, with 39% of the state's oil coming from within California, 16% from Alaska, and
45% from foreign sources. (n17)) Leading suppliers for U.S. oil imports are Canada, Saudi Arabia, Venezuela, Nigeria and Mexico, (n18) and in 2005 U.S. crude oil imports represented nearly 26% of total global imports of crude oil. (n19)
In the coming years through 2030, global demand for oil is expected to increase, though at a slower pace in the developed world (such as the U.S. and Europe) than in developing
countries (especially China and India). More than 70% of the global increase in demand is expected to come from developing countries, (n20) whose demand growth rates are projected to be more than double the overall world rate and triple those of Europe and
the United States. (n21) During this same period in which demand for oil is expected to increase, supply will come to be dominated "by a small number of major producers where oil resources are concentrated. OPEC's share of global supply [is projected]
to increase from 40% now to 42% in 2015 and 48% by [2030]." (n22) In a ranking of proved oil reserves by country in 2006, 10 of the top 15 countries are OPEC nations. The U.S. ranks 11th, and only two non-OPEC nations are in the top 10 - Canada and
Russia. (n23) Along with the progressive shift in supply to a smaller number of producers is a shift in the global oil market toward the "progressive concentration of the world's oil reserves
under the control of national governments and national (state-owned) companies." (n24) Today "77% of the world's oil reserves are held by national oil companies with no private equity, and there are 13 state-owned oil companies with more reserves than ExxonMobil, the largest
multinational oil company." (n25) This shift has been referred to by some as a rise in "resource nationalism," defined as both "national government's assertion of ownership rights over oil and gas reserves against the interests on multinational energy companies," and "national
governments making decisions about production and marketing the hydrocarbon resources under their control not only on the basis of economic factors, but also on the basis of strategic and
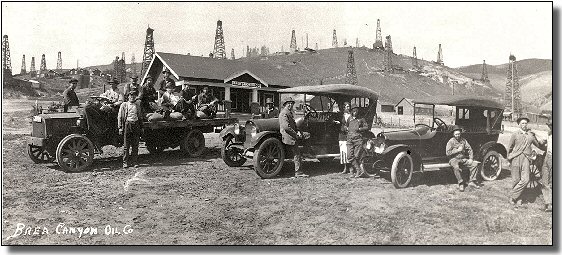
political calculations." (n26) Implications for this "resource nationalism" will be examined in greater depth later in the summer. Photograph: Brea Canyon Oil Company (circa 1920) courtesy of the Fullerton Public Library Launer Local History Room Getting Back to the Here and Now OK, so when you wake up in the morning there won't be much you can do about futures market speculation or Nigerian supply interruptions or demand in Asia, but is there anything you can do to alleviate a bit of "pay'n" at
the pump today? Unfortunately
there isn't much that can make a $4.50 gallon of gas any more affordable, but following are a few links that may help you save a little here and there. Check for the lowest gas prices in your area by visiting www.losangelesgasprices.com,
www.orangecountygasprices.com,
www.riversidegasprices.com, or www.gasbuddy.com. The first three
links will take you to listings of gas prices by individual stations for each of the three geographical areas. The last link will take you to links for the same information but for
a wider list of geographical areas. The site www.drivesmarterchallenge.org will take you on a quick road trip with gas savings tips. You can compare different models of cars and different mpg's to calculate how much you can save on gas with one
type of car vs. another at www.fueleconomy.gov/feg/savemoney.shtml. Read an article about which gas-saving tips really work and which ones don't at
www.edmunds.com/advice/fueleconomy/articles/106842/article.html. Find two opinions on the subject of using regular vs. premium gas at
www.consumerenergycenter.org/transportation/consumer_tips/regular_vs_premium.html and
www.sciam.com/article.cfm?id=fact-or-fiction-premium-g Thank you for visiting the "Essays" page this summer. Please check back in August
for Part II of the "Petromorphosis" series! FOOTNOTES
- The following are the footnotes indicated in the text in parentheses
with the letter "n" and a number. If you click the asterisk at the end of
the footnote, it will take you back to the paragraph where you left
off. n1 - International Energy Agency (IEA), Oil Market Report, Paris: IEA, 13 May 2008, p. 1. (*) n2 - Automobile Club of Southern California, "Auto Club: Two Weeks of 20-Cent Price Hikes Catapult Southern California Gas Price Averages Above $4.50," Automobile Club of
Southern California news releases, June 13, 2008, viewed online June 18, 2008 at http://news.aaa-calif.com/pr/aaa/Gas-Price-Above-Four-Fifty.aspx?ncid=6052. (*) n3 - American Petroleum Institute, The Truth About Oil and Gasoline: An API Primer, June 6, 2008 version of weekly-updated document, API online .pdf Document No. 2008-126A,
most current version available at http://www.api.org/aboutoilgas. (*) n4 - Prepared statement of Dr. Faith Birol, Chief Economist, International Energy Agency, in Geopolitics of Oil, Hearing before the Committee on Energy and Natural
Resources, United States Senate, 110th Congress, First Session, S.Hrg. 110-6, January 10, 2007, Washington D.C.: U.S. GPO, 2007, p. 14. (*) n5 - U.S. Commodity Futures Trading Commission, "CFTC History in the 1970s," viewed online June 14, 2008 at
http://www.cftc.gov/aboutthecftc/historyofthecftc/history_1970s.html. (*) n6 - Organization of the Petroluem Exporting Countries (OPEC), Monthly Oil Market Report, June 2008, Vienna: OPEC, 2008, p. 3. (*) n7 - Briefing - Oil Prices, "Double, Double, Oil and Trouble," The Economist, Vol. 387, No. 8582, May 31, 2008, pp. 73-74. (*) n8 - Statement of Dr. Vincent E. McKelvey, Director, U.S. Geological Survey, Department of the Interior, in Market Performance and Competition in the Petroleum Industry, Hearings before the Special
Subcommittee on Integrated Oil Operations, Committee on Interior and Insular Affairs, United States Senate, 93rd Congress, 2nd Session, Part 5, Serial No. 93-24 (92-59), January/February 1974, Washington D.C.: U.S. GPO, 1974, p. 1540. (*) n9 - National Petroleum Council, U.S. Department of Energy, Hard Truths: Facing the Hard Truths About Energy, Washington D.C.: National Petroleum Council, July 2007, p. 95. (*) n10 - McKelvey, in Market Performance and Competition in the Petroleum Industry, p. 1540. (*) n11 - Birol, in Geopolitics of Oil, p. 11. (*) n12 - IEA, World Energy Outlook 2006, Paris: IEA, 2006, p. 294 (*) n13 - Oil Outlook: Price, Supply, Mergers, Imports and Taxes, Hearings before the Subcommitteeon Fossil and Synthetic Fuels, Committee on Energy and Commerce, U.S. House of Representatives,
99th Congress, 1st Session, July/September/November 1985, Serial No. 99-79, p. 294. (*) n16 - Statement of Daniel Yergin in Foreign Policy and National Security Implications of Oil Dependence, Hearing before the Committee on Foreign Affairs, House of Representatives, 110th Congress, 1st Session, March 22, 2007,
Serial No. 110-33, Washington D.C.: U.S. GPO, 2007, p. 21. (*) n17 - State of California, California Energy Commission, "California's Major Sources of Energy," viewed June 2008, available at
http://energyalmanac.ca.gov/overview/energy_sources.html, or by link through http://www.energy.ca.gov. (*) n18 - United States Department of Energy, Petroleum Supply Monthly, April 2008, available at
http://www.eia.doe.gov/pub/oil_gas/petroleum/data_publications/petroleum_supply_mohthly/historical/2008/ 2008_04/psm_2008_04.html or by link from
http://www.eia.doe.gov/pub/oil_age/petroleum/data_publicationa/petroleum_supply_monthly. (*) n19 - IEA, Key World Energy Statistics, Paris: OECD/IEA, 2007, p. 11. (*) n20 - IEA, World Energy Outlook 2006, p. 85. (*) n23 - Deutch, John and Schlesinger, James R., Chairs, National Security Consequences of U.S. Oil Dependency, New York: Council on Foreign
Relations, 2006, p. 20. (*) n24 - Prepared Statement of Dr. Flynt Leverett in Geopolitics of Oil, p. 43. (*) n25 - Rosenberg, Tina, "The New Nationalization," New York Times Magazine, November 4, 2007, p. 44. (*) n26 - Prepared Statement of Dr. Flynt Leverett in Geopolitics of Oil, p. 43. (*) A combined Bibliography for parts I and II of the 2008 "Petromorphosis" series will be available with the August essay. To return to the top of the
page, click
here. To return to the essay archives, click
here.
Follow www.dorothyswebsite.org on TWITTER! Home | Poetry | Essays |
Free Concerts | Links | 2012 Extras |
About the Site |
|||
 | ||||
|
www.dorothyswebsite.org © 2003 - 2012 Dorothy A. Birsic. All rights reserved. Comments? Questions? Send an e-mail to: information@dorothyswebsite.org | ||||


 Not long ago, $3/gallon gasoline seemed like a remote possibility. Today,
after having become reality, it may become nothing but a memory. With average retail gasoline prices hovering at or above $4.50 per gallon throughout Southern California, the question everyone seems to be asking is "What next?" It is not an easy
question to answer, especially when few forecasters or market analysts foresaw the rapid price escalation which has taken place over the last couple of months.
Not long ago, $3/gallon gasoline seemed like a remote possibility. Today,
after having become reality, it may become nothing but a memory. With average retail gasoline prices hovering at or above $4.50 per gallon throughout Southern California, the question everyone seems to be asking is "What next?" It is not an easy
question to answer, especially when few forecasters or market analysts foresaw the rapid price escalation which has taken place over the last couple of months.