 | |||


 | |||
|
WELCOME TO THE ESSAY ARCHIVES!
<< Part I
(June/July)
<< June
<< June
<< June
<< Part I
(June/July)
* * *
|
It's July, and finally it feels like summer has arrived. With temperatures rising and the sun shining brightly in the sky, what better a time than summer to turn to thoughts of solar energy? The July and August essays will present a two-part look at solar energy - from solar basics to examples of how it currently is being used in some of the areas covered on the site. Over the years, many of the site's articles have been "interactive" in the sense that the reader can go back and forth between the essay text and various information-related links embedded with it. Due to the technical nature of some of the solar technology information, this essay will be even more so, allowing the reader to explore a particular subject in much greater depth or not at all. By clicking a link the reader can view additional information from one or a variety of sources, then return to the essay. (The links are included for information purposes only. No guarantees are made as to the accuracy of the materials presented on the sites, although every effort has been made to search out reliable and respected sources of information.) Footnotes, a list of links and a bibliography also will be included at the end of the text for anyone wishing to learn more about the subject. The materials presented here are only a small fraction of what is available on solar energy and solar technology. A link to a glossary of solar-related terminology from the U.S. Department of Energy/Office of Energy Efficiency and Renewable Energy is provided here as a reference for use as needed. Click here to reach the glossary. * * * Alongside a pedestrian and bicycle path at the edge of the I-35 Highway in Austin, Texas, sunflowers rise, providing shade for pedestrians by day and a glowing blue light at night. These are no ordinary sunflowers, however. They are SunFlowers, an Electric Garden, sculptural solar collectors which provide shade by day and use the solar energy generated for lighting at night. Designed by artists Mags Harries and Lajos Heder (www.harriesheder.com), they form the largest public art project in the city of Austin and generate enough energy fed into the electric grid to fund the maintenance and operating costs of the project. At the 2010 Geneva Motor Show, Swiss firm NLV Solar AG unveiled a running prototype of an electric car which will use solar energy to power its operation. The body of the NLV Quant (www.nlv-quant.com and www.nlv-solar.com) is coated with a thin film of Pyrite which will convert light into energy to power the operating electronics of the car and also support the battery (although some would question if this will actually work (n1)). The company claims it will be fully engineered and ready for production within a year.
Top left: NLV Quant sports car (Photo: NLV Quant press photos); bottom right: Night View of SunFlowers (Photo by David Newsom Photography, courtesy of Megs Harries and Lajos Heder) In the U.S. in 2009, "total U.S. solar electric capacity . . . climbed past 2,000 MW, enough to serve more than 350,000 homes, [though growth was slower than in the years from 2004 - 2008] . . . [In addition,] venture capitalists invested more in solar technologies than any other clean technology in 2009, . . . in total, $1.4 billion." (n2). Novel? Surprising? A sign of the future? The promise of solar power as a virtually inexhaustible source of clean renewable energy has been on the horizon for decades. Technical constraints, industry limitations and cost, however, have all been factors limiting its growth in the past, and "enthusiasm [for solar] . . . hasn't necessarily translate[d] into a market [for its use]." (n3) This first part of the two-part summer "Here Comes the Sun" essays will look at some of the basics of solar power - its history, the technological basis for its generation, and terms and concepts necessary for understanding its production and use (with some of the most important terms in bold text). The second part of the series, coming in August, will move a little closer to home and examine some of the ways in which solar energy is being used locally, especially in the cities and county areas covered in the concert listings on the site. A Brief History of Solar Energy For centuries humans have known the value of the light and heat provided by the sun. In the 1st to 4th Centuries A.D., the famed bathhouses of Rome had large south-facing windows to let in the sun's warmth. Sunrooms on houses and public buildings were so common in the 6th Century A.D. that the Justinian code initiated "sun rights" to ensure individual access to the sun. And in the 1200s, ancestors of the Pueblo people called the Anasazi in North America lived in south-facing cliff dwellings that captured the winter sun. (n4) These might be considered some of the earliest predecessors to what is often referred to today as "passive solar construction," or construction of energy-efficient buildings which "hold solar heat in the home in winter and allow inside heat to escape outdoors during the summer [by] using [appropriate] bulding design, orientation and materials." (n5) Solar thermal applications use the power of the sun for heating water, pools, etc. and can be either passive or active. In general, solar thermal devices use a collector to absorb solar radiation and a circulating fluid to transfer the heat collected and transport it to where it is needed. Baltimore inventor Clarence Kemp patented the first solar water heater in 1891. His patent was bought in 1895 by two businessmen who "established a company in Pasadena, . . . and [by 1897] nearly 30 percent of the houses in Pasadena had solar water heating systems." (n6) The technology which forms the basis of today's solar water heating designs was invented in 1908 by William J. Bailey of the Carnegie Steel Company. His system used "a solar collector with copper coils and a heavily insulated box, . . . [and] his system brought the heated water into a tank on the roof where it was gravity-fed into the house." (n7). Again, many of these units were sold, but "the infant solar water heating industry went into sharp decline during World War II when copper, a key component of the process, was heavily rationed." (n8). (To read more about today's solar space and water heating, visit www1.eere.energy.gov/solar/solar_heating.html and follow the links from the page.) Photovoltaic (PV) technology, or the technology of converting sunlight to electricity, came into existence in the U.S. in 1954. Scientists Daryl Chapin, Calvin Fuller and Gerald Pearson at Western Bell Telephone's Bell Labs developed the first silicon PV cell - the first solar cell capable of converting enough of the sun's energy into power to run everyday electrical equipment. (See also www.californiasolarcenter.org/history_pv.html for more information, or go to www1.eere.energy.gov/solar/solar_timeline.html for links to a 12-page pdf timeline tracing historical developments from the 7th Century B.C. to the future.) Although improvements of the efficiency of the solar cells were made, John Perlin notes in his book From Space to Earth: The Story of Solar Electricity that "Chapin calculated that - with a one-watt cell costing $286 - it would cost a 1956 homeowner over $1.4 million to power their home with the sun." (n9)
While it may not cost a million dollars to power a home with solar energy today, electricity generated from solar sources is still, in many cases, a more expensive option as compared to electricity generated from more traditional existing sources. The break-even cost of PV technology "is defined as the point where the cost of PV-generated electricity equals the cost of electricity purchased from the grid . . . also referred to as grid parity." (n10) In addition to the cost of installing a solar technology (such as a PV) system, the break-even cost is generally "a function of many [regional] variables including the solar resource (amount of sunshine), local electricity prices and various incentives . . . [At present] the only areas where PV is close to or at breakeven is where there is a combination of high electricity prices and good solar resources (like California), or a combination of high electricity prices and incentives (such as New York state and Massachusetts)." (n11) In the U.S., the average retail price of electricity is 11.47 cents/kilowatthour (kWh). Hawaii has the highest prices, 22.89 cents/kWh, Massachusetts and New York the third and fourth highest with prices averaging 17.84 and 17.79 cents/kWh, respectively, and California comes in 8th at 14.7 cents/kWh. (n12) In order to understand some of the factors which have limited the growth of solar power, it is important to understand the basic operation of a photovoltaic (PV) cell. This section will begin with a brief synopsis of the process by which a solar cell converts sunlight to electricity. Those interested in learning more in addition to what follows can click one of these links: 1) www1.eere.energy.gov/solar/animations.html. This is a quick (about 1 minute) video in MPEG or
Quicktime illustrating the process by which a cell converts sunlight to energy (U.S. Department of Energy, Office of Energy Efficiency and Renewable Energy)
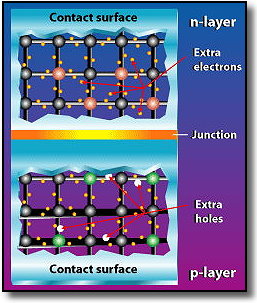
Although several different semiconductor materials may be used for PV cells, the description included here is for crystalline silicon, the most common type of PV cells. Each PV cell consists of two layers of somewhat differing crystalline silicon semiconductor material (see diagram): an "n-type" layer with an abundance of electrons which have a negative electric charge, and a "p-type" layer with an abundance of "holes" which have a positive electrical charge. When the two layers come in contact, excess electrons move from the n-type side to the p-type side; at the same time the holes move in the opposite direction where they await incoming electrons. Because of the flow of electrons and holes, the two semiconductors behave like a battery, creating an electrical field at the surface where they meet, or the p/n junction. (Read more at www1.eere.energy.gov/solar/photoelectric_effect.html.) Diagram Source: U.S. Department of Energy, Office of Energy Efficiency and Renewable Energy, Solar Energies Technology Program, PV Basics: The Photoelectric Effect When sunlight shines on a PV cell, the light may be reflected, absorbed or pass through it. Only light which is absorbed generates electricity. If you can picture a prism or a rainbow, you can understand that light is divided into different wavelengths, some visible to the human eye and some not. Each wavelength has a different frequency and energy. Sunlight is composed of photons, or particles of solar energy, each with varying amounts of energy corresponding to their wavelength. (www1.eere.energy.gov/solar/pv_cell_light.html) The energy of absorbed light is transferred to electrons in the atoms of a PV cell. With this new energy, atoms "escape" from their normal position (bonds) in the atom and become part of the electrical flow, or current, in the electrical circuit. However, only photons with a certain level of energy (i.e. from certain wavelengths) can free electrons in a particular semiconductor material from their atomic bonds to produce the current. This level of energy, known as the bandgap energy (www1.eere.energy.gov/solar/bandgap_energies.html), is the amount of energy required to dislodge an electron from its covalent bond and allow it to become part of an electrical circuit. The amount of energy converted into electrical energy from the light which falls on the cell is called the cell's conversion efficiency. Understanding this concept is key to understanding some of the limitations of current PV technology. The average conversion efficiency of crystalline silicon PV cells is about 15 - 20 percent, and slightly lower, about 8 - 10 percent, for thin film PV technology (another type of PV technology) (n14). Improving this conversion efficiency is a key goal of much research in the field, with the aim of making solar energy more cost competitive with other more traditional sources of energy. Other factors which can affect a PV cell's efficiency include: climate conditions (such as clouds or fog), direct recombination (the recombination of electrons and holes before they reach the electrical circuit), electrical resistance, temperature (since as the temperature rises much of the light energy shining on cells becomes heat), and reflection of light aways from the cell's surface. (www1.eere.energy.gov/solar/quantum_efficiency.html) Untreated silicon is a shiny gray material which can reflect more than 30% of the light that shines on it. Two techniques used to reduce silicon reflection are coating the top surface with silicon monoxide and texturing the top surface with chemical etching. (www1.eere.energy.gov/solar/antireflective_coating.html) One PV cell produces only about 1 - 2 watts of energy, so cells are connected together electrically and packaged in a weather-tight module. Modules are connected together to form an array, a term referring to the entire generating plant. The number of modules connected in an array depends on the amount of power output needed.
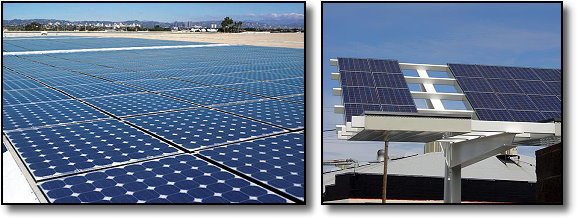
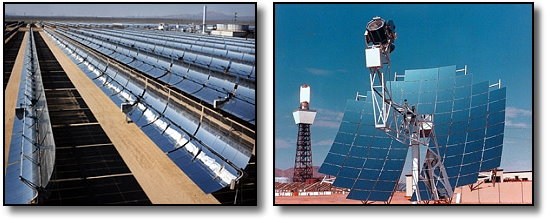
Left: Modules of rooftop PV array at the Marina Processing and Distribution Center of the U.S. Postal Service, Inglewood, CA. Source: Courtesy of U.S. Department of Energy, National Renewable Energy Laboratory Photographic Information Exchange, Credit - SunPower. Right: Solar panels at the Sacramento Municipal Utility District (SMUD) solar-powered hydrogen vehicle fueling station. As the solar panels make electricity, an electrolyzer at the station will use that energy to separate water into hydrogen to make fuel for hydrogen-powered vehicles. When not being used to produce hydrogen for vehicles, the power produced by the panels will go into the SMUD grid. Source: Courtesy of U.S. Department of Energy, National Renewable Energy Laboratory Photographic Information Exchange, Credit - Keith Wipke. Utility-Scale Solar Power Uses for PV cells can range from applications as small as a solar-powered watch or calculator to ones as large as a power plant measured in acres. Electricity generated in these large applications is generally referred to as utility-scale solar power, with power generated in the range of 50 - 100 MW or more. In addition to large-scale applications of PV technology, utility-scale operations also use a type of solar thermal technology called concentrating solar power. Concentrating solar power plants generate electricity "by using heat from solar thermal collectors to heat a fluid which produces steam that is used to power [a] generator." (n15) Three of the main types of thermal concentrating solar power systems will be described briefly, and two are pictured below. On the left are the collectors in a parabolic trough system, and on the right a concentrating solar dish. The third type of system (not pictured) is a solar power tower system. Although the principle behind the workings of each of these systems is the same, the actual operation of each of the three types of concentrating solar power is different.
Left: Parabolic trough concentrating solar collectors generating power in the Mojave Desert. Source: Courtesy of the U.S. Department of Energy. Right: Concentrating solar power dish stirling system at Southern California Edison Solar One test site (2000). Source: Courtesy of U.S. Department of Energy, National Renewable Energy Laboratory Photographic Information Exchange, Credit - Sandia. California's largest solar power facility, located in the Mojave Desert at Kramer Junction, uses a parabolic trough collector system. In these systems, the parabolic trough focuses the sun's rays on the fluid-filled received pipes at the focus of the unit. (In the picture above, the pipes appear as a thin line at the center of the collector. On the left side of the picture you can see the pipe held by thin "arms" above the surfact of the collector.) "Because of its parabolic shape, a trough can focus the sun at 30 to 100 times its normal intensity (the concentration ratio) on the receiver pipe, achieving operating temperatures of over 750 degress Farenheit." (n16) The fluid moves through the pipes, eventually "transferring its heat to water to generate high-pressure, super-heated steam. The steam is then fed to a conventional steam turbine and generator to produce energy. When the hot fluid passes through heat exchangers it cools down and is then recirculated through the solar field to heat up again." (n17) During the day, the collectors in these systems also tilt as the sun moves, following its path (tracking), to ensure that the sun is always on the collector. Solar power towers are the newest of the three technologies, and if you've ever used a small mirror to try and catch the reflection of the sun and shine it on someone, you're likely to understand the basic operation of these systems. The systems use thousands of flat sun-tracking mirrors called heliostats to reflect solar heat to a thermal receiver mounted on a tower. The concentrated heat boils the water (or a specific liquid) within the receiver and produces steam. As with the parabolic system, the steam is piped to a turbine and powers a standard turbine and generator. The steam is then cooled and the process repeats. The energy in these systems "can be concentrated as much as 1500 times that of the energy coming in from the sun." (n18) A local (Pasadena) company (eSolar, www.esolar.com) develops these solar power tower systems. Their company brochure describes the basic 46MW power unit as having 16 towers and thermal receivers, 192,000 heliostats [spread out] over 200 acres, and a temperature of the steam generated of 440 degrees Celsius.(n19) Solar dish/engine systems operate in a slightly different manner than the other two concentrating solar power systems. Pictured above on the right, the systems consist of a dish structure, associated mirrors and an engine at the focal point of the mirrored dish (you can find a diagram illustrating the different pieces of a dish/stirling system at www.stirlingenergy.com/how-it-works.htm). Solar dishes "always point straight at the sun and concentrate the energy at the focal point of the dish . . . The engine in [the] dish/engine system converts heat to mechanical power [with a piston/fluid system] . . . and is coupled to an electric generator to convert the mechanical power to electric power." (n20) Some solar dish/engine concentrating system have peak efficiencies in the range of 30%. (n21). To view a two-minute video on concentrating solar power, visit www1.eere.energy.gov/multimedia/video_csp.html. Also, a detailed report discussing each of the three types of thermal concentrating solar power, their advantages and disadvantages and more, can be downloaded in pdf format from the Greenpeace website at www.greenpeace.org/usa/press-center/reports4/solar-thermal-power-2020.
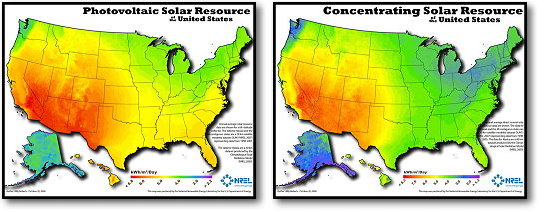
Number One Sun Despite the fact that there is only one sun, not all sunlight is the same in all locations, a fact which can dictate which types of solar systems will or will not work in certain areas. Daily levels of sunlight in any area can vary due to weather, other atmospheric conditions, time of year, or any number of other factors. The National Renewable Energy Lab publishes solar insolation maps, with insolation values defined as the solar resource available to a flat plate collector, such as a PV panel, oriented due south at an angle from horizontal equal to the latitude of the collector location. (n22) In other words, insolation is "the actual amount of sunlight falling on a specific geographic location . . . or 'incident solar radiation'." (n23) Phoenix is the area in the U.S. with the highest insolation and "is seen by many renewable energy enthusiasts as an idyllic solar capital . . . [with] more than 300 days of sunshine a year." (n24) The two maps below are different, with one showing solar resources for PV systems and the other for concentrating solar systems (the difference will be explained a bit more below). Since you will not be able to read the text on these small versions of the maps, the maps show the amount of solar resource available throughout the U.S. measured in kWh/m2/day. Areas in red indicate the highest levels of insolation, and areas in blue or purple indicate the lowest insolation levels. To view larger versions of each of the maps, visit the NREL website at www.nrel.gov/gis/solar.html and click the link to the map you would like to see.
To understand why the maps are different, it is necessary to understand the difference between direct and diffuse light. "Direct light consists of radiation that comes straight from the sun, without reflecting off clouds, dust, the ground or other objects . . . Diffuse light is sunlight that is reflected off clouds, the ground or other objects." (n25) PV systems can use either type of light, but concentrating solar thermal power systems can only use direct light. "To be effective, [concentrating solar thermal (CST)] systems require a consistent supply of high quality solar radiation . . . [or minimum] direct insolation of around 5.5 kWh/m2/day . . . Conditions in North America favorable enough to support CST are in the U.S. Southwest. Elsewhere, South Africa, Australia, Northern Africa, Spain, Brazil and parts of India and China have suitable conditions for CST development . . . The main thing making CST bankable is the quality of the sunlight." (n26) After all the above factors (sunlight, technology, location, etc.) have been taken into consideration, the remaining factors which may contribute to the use of solar power are the financial and/or tax incentives offered for its use. The second part of the essay, coming in August, will look at incentives for use of solar energy systems, particularly in California, and continue with the general overview of local uses of solar power today. * * * Thank you for visiting the Essays section this month. Please come back again in August for Part 2 of "Here Comes the Sun . . ." The second essay of the two-part series will look at solar energy incentives, including the California Solar Initiative, plus examples of how solar energy is being used in some of the cities covered on the site. FOOTNOTES - The following are the footnotes indicated in the text in parentheses with the letter "n" and a number. If you click the asterisk at the end of the footnote, it will take you back to the paragraph where you left off. n1 - Diermann, Ralph, "A Quantum Leap With Pyrite Cells," PV Magazine, August 2009, pp. 53 - 55. (*) n2 - Solar Energy Industries Association (SEIA), U.S. Solar Industry: Year in Review 2009. Washington, D.C.: SEIA, April 15, 2010, p. 2. (*) n3 - Warren, Chris, "A Long, Strange Trip," Photon, November 2009, p. 27. (*) n4 - U.S. Department of Energy, Office of Energy Efficiency and Renewable Energy, History of Solar Timeline. Viewed online July 2010 at www1.eere.energy.gov/solar/solar_timeline.html. (*) n5 - Sklar, Scott and Sheinkopf, Kenneth G. Consumer Guide to Solar Energy, 3rd Edition, Chicago, IL: Bonus Books, 2002, pp. 9 - 10. (*) n9 - Perlin, John, From Space to Earth: The Story of Solar Electricity, as cited in Warren, Chris, "A Long Strange Trip," p. 20. (*) n10 - Denholm, Paul, Margolis, Robert M., Ong, Sean, and Roberts, Billy, Break-Even Cost for Residential Photovoltaics in the United States: Key Drivers and Sensitivities, Golden, Colorado: U.S. Department of Energy, National Renewable Energy Lab (NREL), December 2009, p. 1. (*) n11 - Ibid., p. 1 and p. 6.(*) n12 - Matz, Michael D., "The 13 Solar Colonies," Photon, November 2009, p. 31. (*) n13 - U.S. Department of Energy, Office of Energy Efficiency and Renewable Energy, "Photovoltaic Basics" and successive pages, viewed online July 2010 at www1.eere.energy.gov/solar/pv_basics.html. (*) n14 - Ekiss, Brent, and Traver, Rick, "Methods and Materials Behind the Latest Concentrator Photovoltaics," Solar Industry, Vol. 2, No. 9, October 2009, p. 28. (*) n15 - U.S. Department of Energy, Energy Information Administration (EIA), "Energy Explained: Your Guide to Understanding Energy," viewed online July 2010 at www.eia.doe.gov/energyexplained/index.cfm?page=solar_home. (*) n16 - U.S. Department of Energy, Energy Information Administration (EIA), "Solar Thermal Power Plants," viewed online July 2010 at www.eia.doe.gov/energyexplained/index.cfm?page=solar_thermal_power_plants. (*) n19 - "eSolar Utility-Scale Power," eSolar company brochure, Pasadena: eSolar, Inc., 2008-2009. (*) n20 - U.S. Department of Energy, EIA, "Solar Thermal Power Plants." (*) n21 - Greenpeace/European Solar Thermal Power Industry Association, Solar Thermal Power 2020, Amsterdam: The Netherlands, Greenpeace, 2003 (date uncertain), p. 11. (*) n22 - U.S. Department of Energy, National Renewable Energy Lab, Dynamic Maps, GIS Data and Analytical Tools: Solar Maps. Viewed online July 2010 at www.nrel.gov/gis/solar.html. (*) n23 - U.S. Department of Energy, Office of Energy Efficiency and Renewable Energy, "Light and the PV Cell." Viewed online July 2010 at www1.eere.energy.gov/solar/pv_cell_light.html. (*) n24 - PES: Power and Energy Solutions, European Edition, PES Exclusive, "PV Comes of Age - Solar Power and the Push for Mainstream Acceptance," PES: Europe, Issue 12, 2009, p. 20. (*) n25 - U.S. Department of Energy, Office of Energy Efficiency and Renewable Energy, "Light and the PV Cell." Viewed online July 2010 at www1.eere.energy.gov/solar/pv_cell_light.html. (*) n26 - Wagman, David, "Utilities Take a Shine to Solar Power," Renewable Energy World Magazine North America, September/October 2009, p. 32. (*)
LINKS INCLUDED IN ESSAY - The following are links included in the essay.
BIBLIOGRAPHY - The following is the Bibliography for the July 2010 essay. Denholm, Paul, Margolis, Robert M., Ong, Sean, and Roberts, Billy, Break-Even Cost for Residential Photovoltaics in the United States: Key Drivers and Sensitivities, Golden, Colorado: U.S. Department of Energy, National Renewable Energy Lab (NREL), December 2009 Diermann, Ralph, "A Quantum Leap With Pyrite Cells," PV Magazine, August 2009, pp. 53 - 55 Ekiss, Brent, and Traver, Rick, "Methods and Materials Behind the Latest Concentrator Photovoltaics," Solar Industry, Vol. 2, No. 9, October 2009, pp. 28 - 30 "eSolar Utility-Scale Power," eSolar company brochure, Pasadena: eSolar, Inc., 2008-2009 "From Space to Earth Part One: Photoelectric Dreams", excerpts from Perlin, John, From Space to Earth: The Story of Solar Electricity as published in PV Magazine: Photovoltaic Markets and Technology," July 2009, pp. 30 - 33 "From Space to Earth Part Two: The Dream Becomes Real", excerpts from Perlin, John, From Space to Earth: The Story of Solar Electricity as published in PV Magazine: Photovoltaic Markets and Technology," August 2009, pp. 22 - 27 "From Space to Earth Part Three: Searching for Applications", excerpts from Perlin, John, From Space to Earth: The Story of Solar Electricity as published in PV Magazine: Photovoltaic Markets and Technology," September 2009, pp. 24 - 32 Greenpeace/European Solar Thermal Power Industry Association, Solar Thermal Power 2020, Amsterdam: The Netherlands, Greenpeace, 2003 (date uncertain) "Growing Pains: The Rise of Big Solar,", Economist, Vol. 395, No. 8678, April 17, 2010, pp. 69 - 70 Masia, Seth, "Hybrid Utility-Scale Concentrating Solar Power," Solar Today, September/October 2009, p. 60 Matz, Michael D., "The 13 Solar Colonies," Photon, November 2009, pp. 28 - 33 Mintz, Paula, "The Emerging U.S. Solar Market," Renewable Energy Focus, U.S. Solar Supplement, Elsevier Publishing, October 2009, pp. 14 - 17 PES: Power and Energy Solutions, European Edition, PES Exclusive, "PV Comes of Age - Solar Power and the Push for Mainstream Acceptance," PES: Europe, Issue 12, 2009, pp. 18 - 20 Schaeffer, John, Solar Living Sourcebook, 12th Edition, Hopland, CA: Gaiam Real Goods, 2005 Sinclair, Mark, "Creating Demand - How to Market Solar," Renewable Energy Focus, U.S. Solar Supplement, Elsevier Publishing, October 2009, pp. 18 - 21 Sklar, Scott and Sheinkopf, Kenneth G. Consumer Guide to Solar Energy, 3rd Edition, Chicago, IL: Bonus Books, 2002 Solar Energy Industries Association (SEIA), U.S. Solar Industry: Year in Review 2009. Washington, D.C.: SEIA, April 15, 2010 Solar Electric Power Association (SEPA)/Solar Energy Industries Association, Solar Power International 09 Conference and Expo Guide, Anaheim, CA: SEPA/SEIA, October 2009 U.S. Department of Energy, Energy Information Administration (EIA), "Energy Explained: Your Guide to Understanding Energy," viewed online July 2010 at www.eia.doe.gov/energyexplained/index.cfm?page=solar_home U.S. Department of Energy, Energy Information Administration, "Solar Thermal Power Plants," viewed online July 2010 at www.eia.doe.gov/energyexplained/index.cfm?page=solar_thermal_power_plants U.S. Department of Energy, National Renewable Energy Lab (NREL), Dynamic Maps, GIS Data and Analytical Tools: Solar Maps. Viewed online July 2010 at www.nrel.gov/gis/solar.html U.S. Department of Energy, Office of Energy Efficiency and Renewable Energy (EERE), History of Solar Timeline. Viewed online July 2010 at www1.eere.energy.gov/solar/solar_timeline.html U.S. Department of Energy, Office of Energy Efficiency and Renewable Energy, "Photovoltaic Basics" and successive pages, viewed online July 2010 at www1.eere.energy.gov/solar/pv_basics.html. Includes "Photoelectric Effect," "Photovoltaic Basics," "Light and the PV Cell," "Quantum Efficiency Measurements," "Bandgap Energies of Semiconductors and Light," and "Anti-Reflective Coating" Wagman, David, "Utilities Take a Shine to Solar Power," Renewable Energy World Magazine North America, September/October 2009, pp. 28 - 35 Warren, Chris, "A Long, Strange Trip," Photon, November 2009, pp. 15 - 27 Wiser, Ryan, Barbose, Galen, Peterman, Carla, and Darghouth, Naim, Tracking the Sun II: The Installed Cost of Photovoltaics in the U.S. from 1998 - 2008, Lawrence Berkeley National Laboratory, October 2009. Viewable online at http://eetd.lbl.gov/ea/ems/re-pubs.html
To return to the top of the page, click here. To return to the essay archives, click here. Follow www.dorothyswebsite.org on TWITTER! Home | Poetry |
Essays | Free Concerts | Links | 2010 Extras |
About the Site |
||
 | |||
|
www.dorothyswebsite.org © 2003 - 2010 Dorothy A. Birsic. All rights reserved. Comments? Questions? Send an e-mail to: information@dorothyswebsite.org | |||


 "Here Comes the Sun . . ."
 Understanding Photovoltaic (PV) Basics
 The Inner Workings of a PV Cell